Search
Steamboat Springs Real Estate

Market Statistics

There is so much more to the real estate transaction than simply finding the property and writing a contract. I take great pride in sharing with my clients the many relevant aspects of the Steamboat Springs real estate market to guide them in making informed decisions on important real estate decisions. Please keep in mind that the information contained here is only a small example of the wide range of research and data analysis for which I am renowned. Let me know if there is something specific about the market, or even the particular property you are interested in buying or selling, that I can provide.

General Market Conditions & Trends
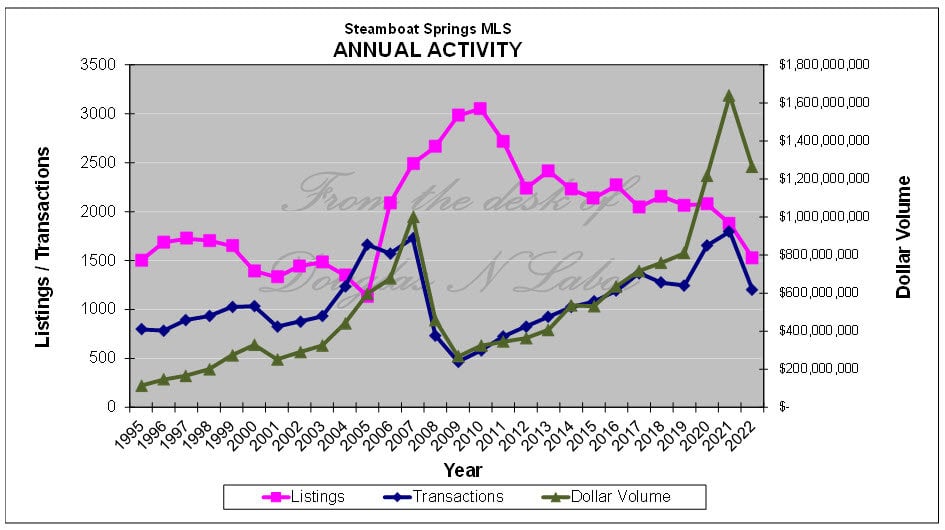
Chart of Steamboat Springs annual listings, transactions, and dollar volume from 1995 to 2022.

Annual Activity

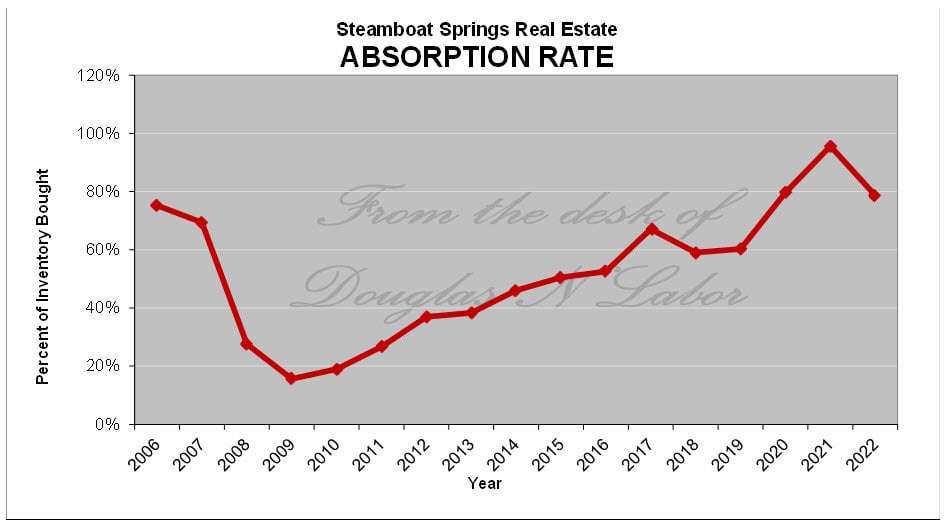
Steamboat Springs absorption rate chart, 2006–2022; it bottoms in 2009 and peaks in 2021.

Absorption Rate

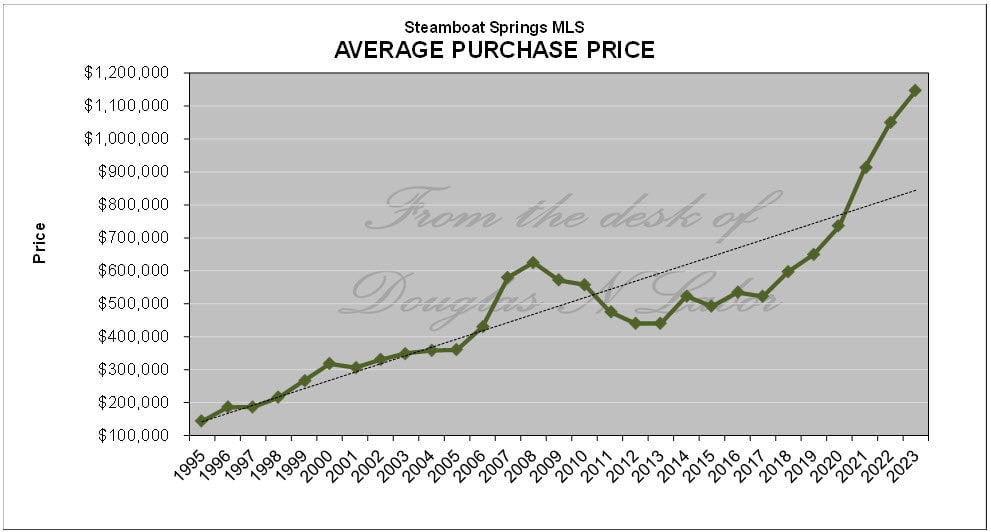
Steamboat Springs average purchase price chart, rising sharply after 2020 to over $1.1 million in 2023.

Average Price

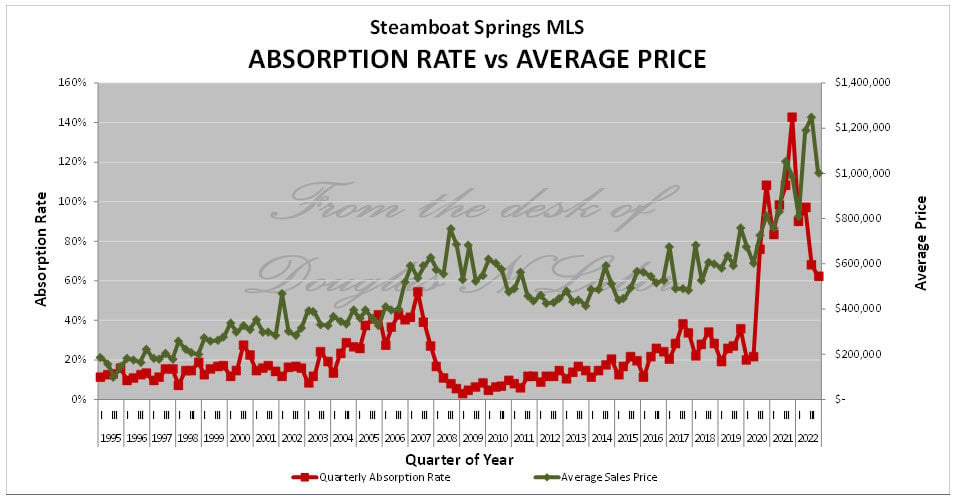
Steamboat Springs MLS chart comparing quarterly absorption rates and average sales prices from 1995 to 2022.

Absorption vs Price

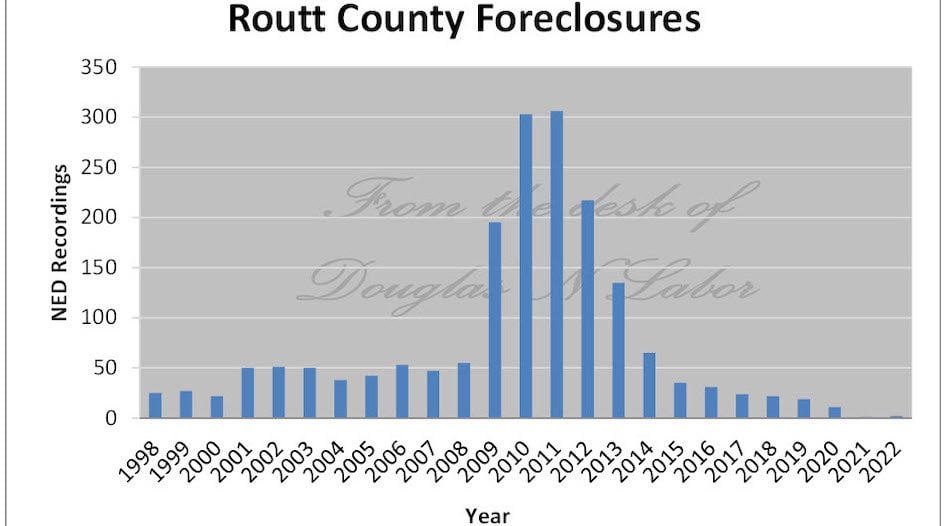
Bar chart of Routt County foreclosures by year, peaking near 300 recordings in 2010 and 2011.

Foreclosures

2022 Resort Report

Resort Report

Property Types

Single Family Homes & Condominiums

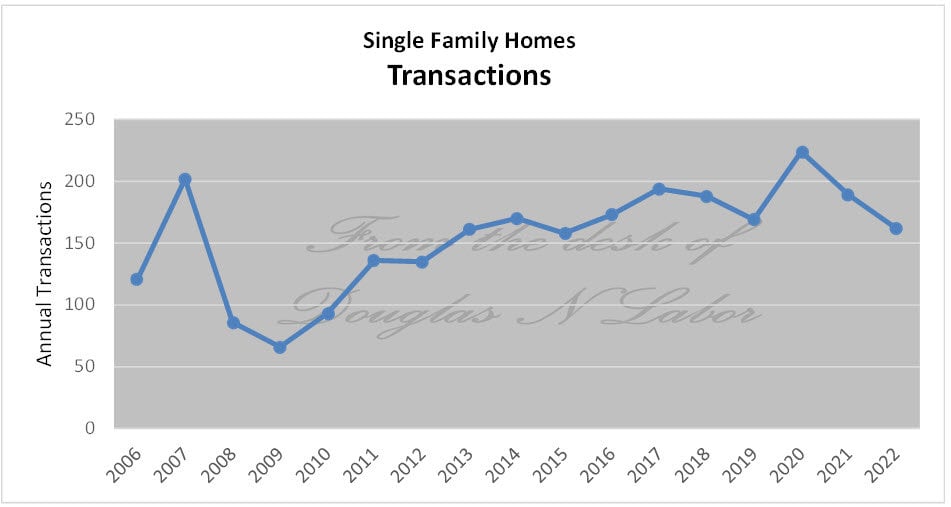
Line chart showing annual single-family home transactions from 2006 to 2022.

Annual Transactions

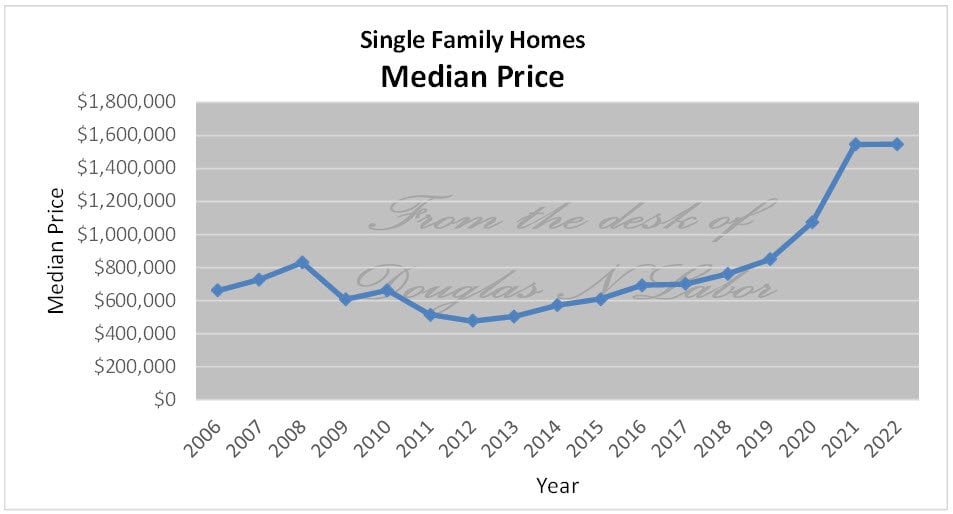
Line chart of median single-family home prices from 2006 to 2022, rising sharply after 2019.

Median Price Trend

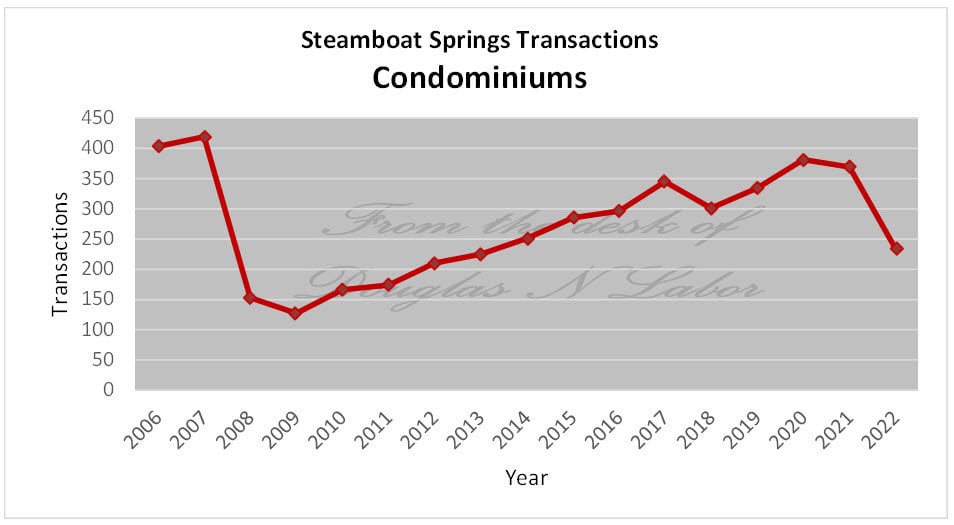
Line chart of annual Steamboat Springs condominium transactions from 2006 to 2022.

Annual Transactions

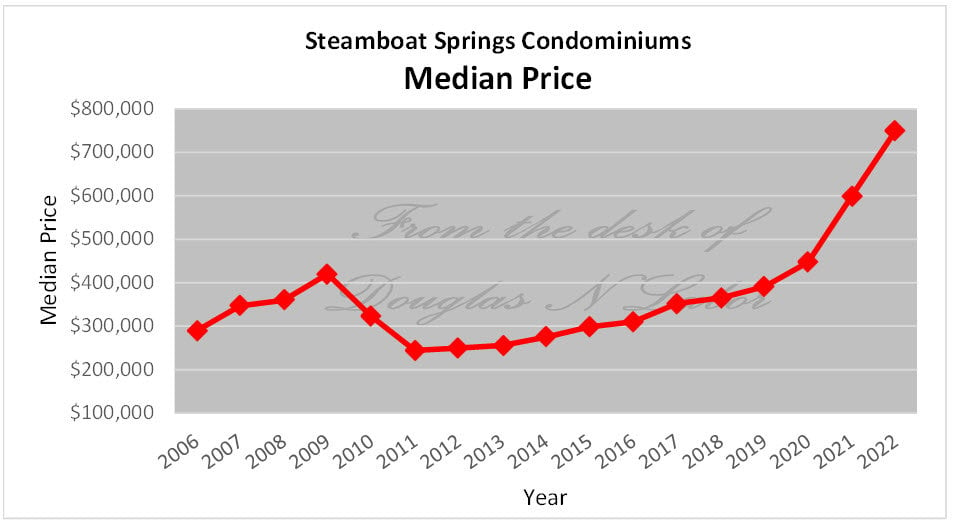
Line chart of median prices for Steamboat Springs condominiums from 2006 to 2022.

Median Price Trend

Townhomes & Lnad

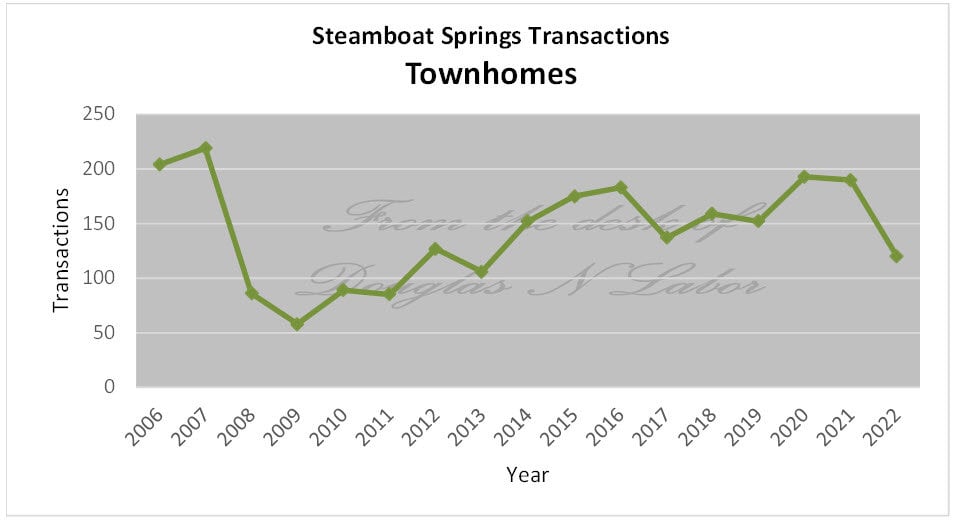
Steamboat Springs townhouse transactions, 2006–2022; the line peaks in 2007 and declines to about 120 in 2022.

Annual Transactions

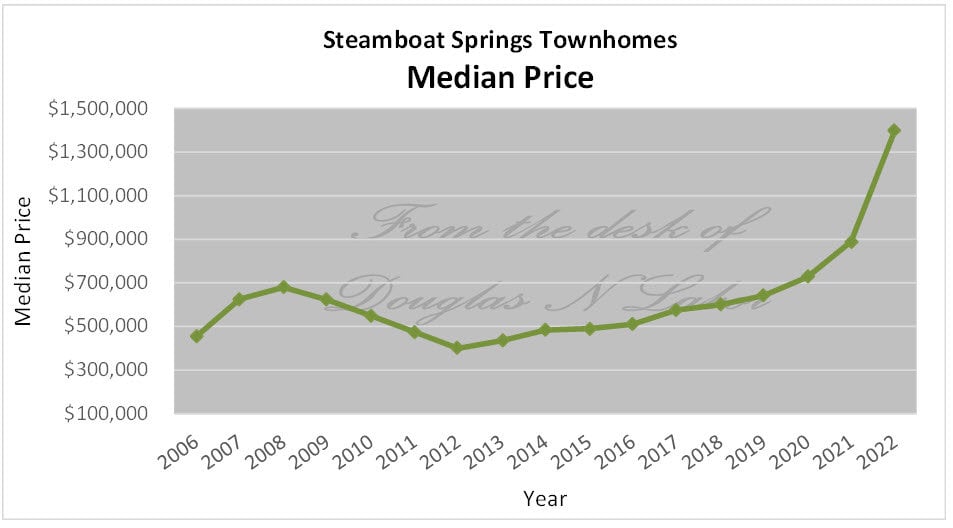
Steamboat Springs townhome median price chart, rising sharply to about $1.4 million in 2022.

Median Price Trend

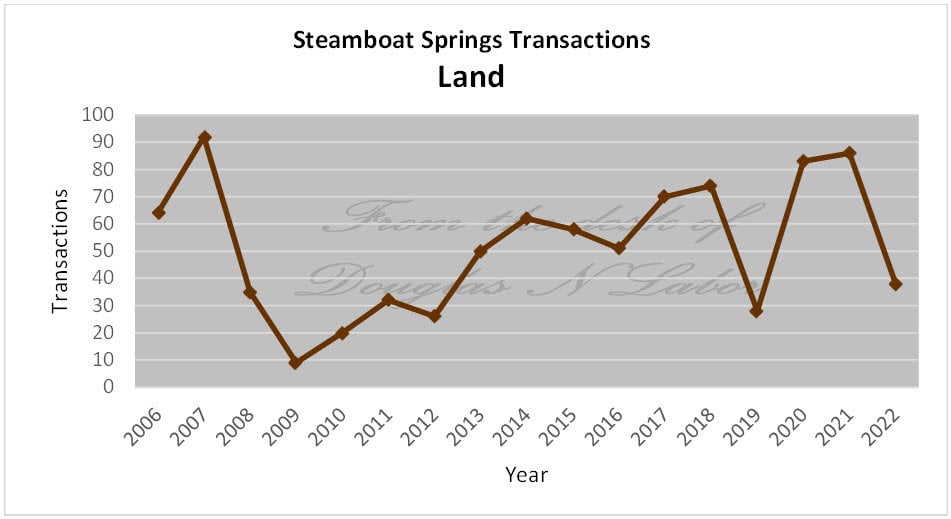
Steamboat Springs land transactions, 2006–2022, shown in a line chart with peaks in 2007 and 2020–2021.

Annual Transactions

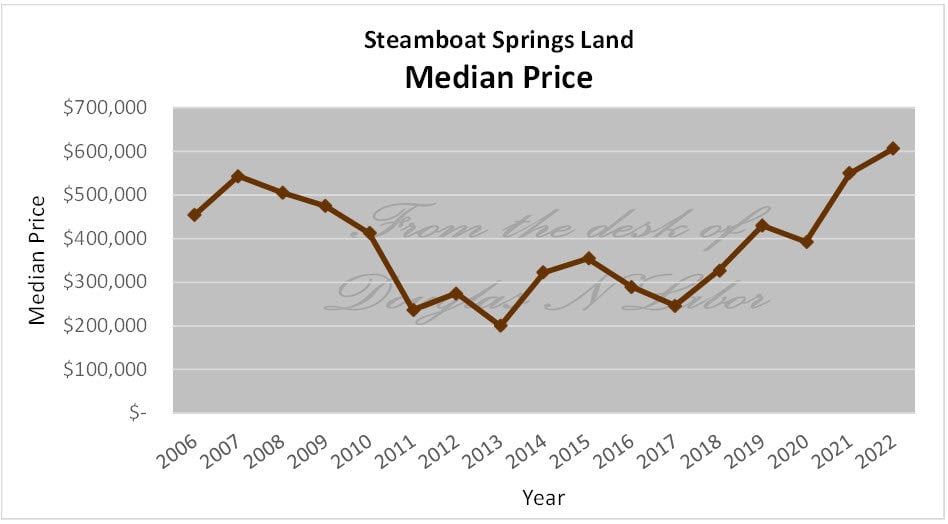
Steamboat Springs land median price chart, rising to about $600,000 in 2022 after a low near $200,000 in 2013.

Median Price Trend

Steamboat Springs Luxury Market

(Top 15%)

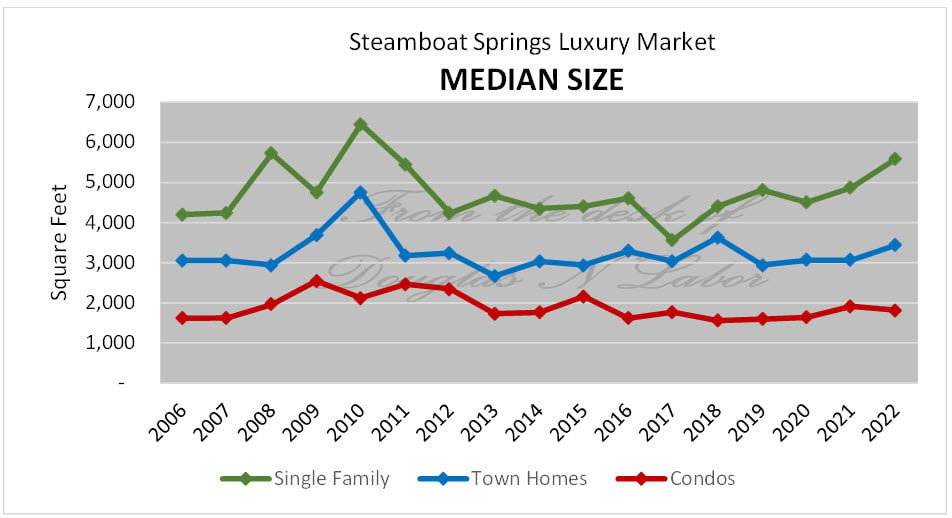
Chart comparing median square footage of Steamboat Springs single-family homes, town homes, and condos from 2006 to 2022.

Median Size

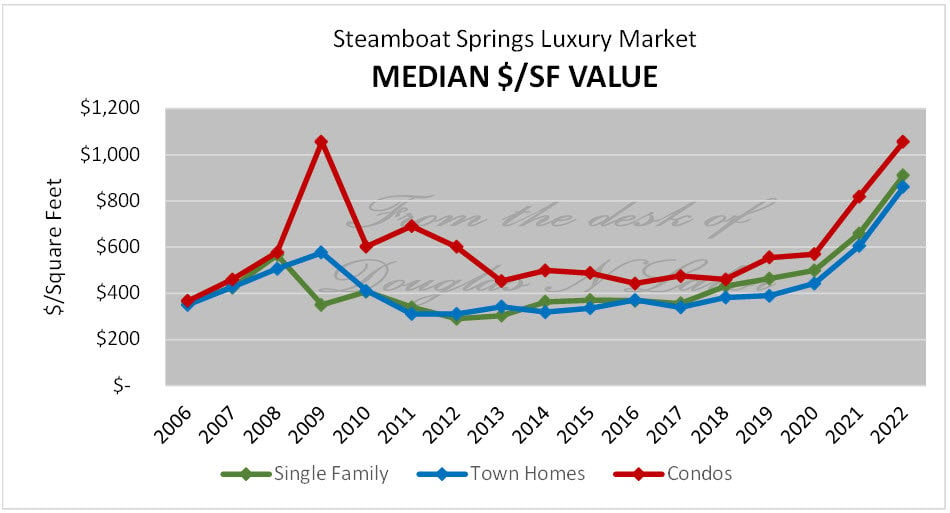
Steamboat Springs luxury market median price-per-square-foot chart, comparing single-family homes, town homes, and condos from 2006 to 2022.

Median $/SF

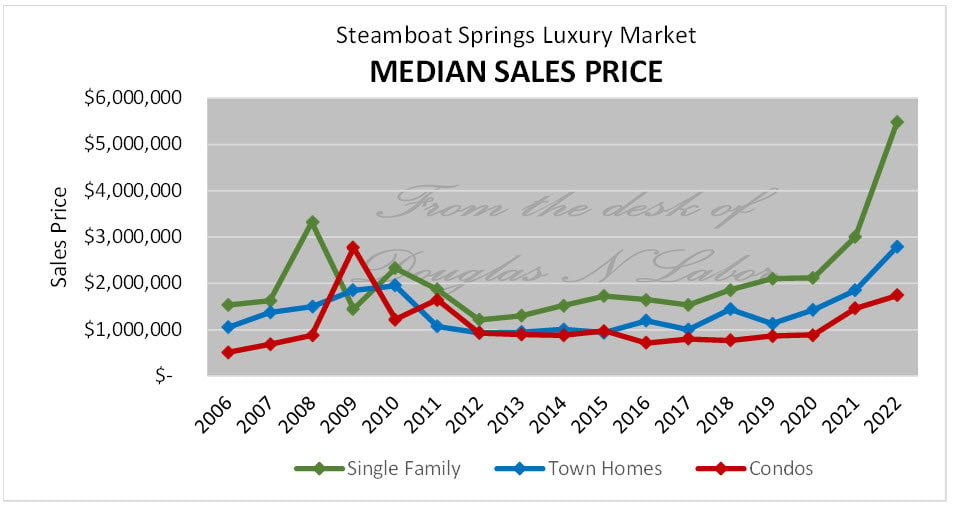
Chart of Steamboat Springs luxury median sales prices by property type, 2006–2022.

Median Price

Follow Us On Instagram